 |
Control >> Aggregation >> Evolving clustering formation
Evolving Clustering Formation
These works focus on the evolution of
controllers capable of generating self-organised clustering of a group
of s-bots distributed in a closed arena. The size of the arena is
bigger than the perceptual range of the
s-bots to emphasise the locality of sensing. The arena does not contain
any environmental signals.
Experimental setup
The s-bots are initially scattered in a walled squared
arena 3 x 3 meters. Their task is to get close to each other in
order to form a single group of agents. As in the experiments
described here
the s-bots can only rely on local information which is
provided by proximity sensors for obstacle avoidance behaviour and
by a sound signalling system. The aggregation is particularly
difficult due to the fact that the arena in which the
s-bots are located is bigger than the agents' perceptual
range. Therefore, the s-bots have to: i) employ an
exploratory behaviour to be able to perceive each other; ii) once
in the proximity of one or more s-bots, each agent has to
coordinate its motion through the exploitation of sound signalling
in order to approach its neighbours; iii) collisions has to be
carefully avoided by exploiting the information provided by the
proximity sensors.
Given the high computational costs of simulations required by the
tasks described in this section, we chose to employ the fast
s-bot model (see Simulator). Each
s-bot has control only on its two motorised wheels.
Additionally, it is equipped with a simulated speaker that can
emit a tone for long range signalling. s-bots can perceive
the intensity of sound using three sound sensors that simulate
three directional microphones using a set of equations. The
tone emitted by an s-bot can be perceived by another
s-bot from a distance of up to 75 cm. Beyond this value,
the tone is covered by noise, simulated adding a random component
uniformly distributed within 5% of the sensor saturation
value. Short range detection of obstacles or of other
s-bots is achieved using 8 proximity sensors, simulated
using a sampling technique. Also in this case, noise is
simulated adding a random component uniformly distributed within
5% of the sensor saturation value.
The s-bot is controlled by a single layer perceptron, whose
connection
weights are encoded in a binary genotype. The perceptron has 12 sensory
neurons,
that encode the state of the 8 proximity sensors, of the 3 sound
sensors and of a bias unit (i.e., a unit whose activation state is
always 1.0).
In a preliminary set of experiments, we devised a
fitness function that takes into account the number n of s-bots
used in
each evaluation. In each epoch, the genotype is evaluated for its
ability to minimise the average distance of all s-bots from the
centre
of mass of the group. This is called aggregation quality D(t).
In a second set of experiments, a second component S(t), called motion
quality, has been added. S(t) accounts
for straight motion of s-bots and was introduced to avoid a
turning-on-the-spot behaviour of the s-bots when
aggregated, which was observed to be a local optimum in which the
evolved strategies often converged using the aggregation quality only.
Results
In the first set of experiments, i.e., those in which the fitness
function has only one component D(t), the behaviours evolved are
classified into two categories, based on the strategies evolved. The
first behaviour, called the static clustering behaviour,
creates compact clusters where s-bots stay close to each other and do
not change their relative positions. The second behaviour, called floating
clustering behaviour, creates rather loose but moving clusters,
thus resulting in a scalable behaviour.
In the second set of experiments, i.e., those in which the fitness
function has two components D(t) and S(t), we managed to generate
fully scalable aggregation behaviours. The evolutionary experiment
was replicated 20 times, starting with different randomly
initialised populations. Aggregation behaviours were successfully
generated in each replication. Figure 1 plots the average fitness
of the 20 replications of the experiment. The best genotype of the
population reaches in average 60% of the theoretical maximum
value. It is important to bear in mind that the fitness is the
result of a product, whose factors assume values in the range
[0,1]. Thus, a value around 60% may be the result of two
components that have both high performance values, around
80%.
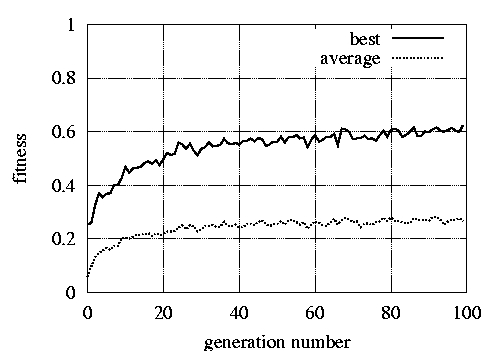
Figure 1:Performance across 100 generations, averaged over 20
replications.
The fitness of the best genotype and the average fitness of the
population are plotted against the generation number.
In order to assess the performance achieved by the evolved
strategies, for each replication of the experiment, we selected
the best 20 genotypes of the last generation, and we evaluated
their fitness for 200 times (i.e., 200 epochs). Then, for each
replication, we selected the genotype with the highest average
fitness. It is possible to notice that these performances are
slightly lower than the average fitness values of the best
genotypes reached at the end of the evolutions, This is mainly due
to an over-estimation of the performance of the best genotype
during the evolution. In fact, given a limited number of epochs,
the fitness value F of a genotype is just an estimate of its real
performance. Since only the best cases are retained by the
selection operator, performances measured during evolution
represent an over-estimate of the real performance that can be
obtained by those genotypes.
A qualitative analysis of the evolved controllers reveals that
different replications result in slightly different behaviours. Some
similarities can be observed among the evolved solutions. For example,
solitary s-bots tend to explore the arena moving in large
circles and
turning away from obstacles when they are too close to them. The
evolved solutions differ mainly in the behaviour of s-bots when
they
are close to each other. In general, all evolved strategies rely on a
delicate balance between attraction to sound sources and repulsion
from obstacles, the former being perceived by sound sensors, the
latter by proximity sensors. For the sake of simplicity, we will
describe here the behaviour of the controller produced by the tenth
replication of the experiment.
The following movies show an example of this behavior:
Aggregation
Example Movie with the fast simulation model (MPEG 7.6 MB)
Aggregation
Example Movie with the detailed simulation model (MPEG 7.1 MB)
This controller not only has a good performance, but it also presents
the best scalability properties, as discussed later. In
this case, the interaction between attraction and repulsion from other s-bots
creates a ``following behaviour'' that can be
observed with
small groups of s-bots (see Figure 2 left). When the
number of s-bots increases, this ordered ``following
behaviour'' is
replaced by a
disordered motion of the s-bots, which continuously change
their
relative position, so that the aggregate continuously expands and
shrinks, slightly moving across the arena (see Figure 2 right). This
feature of the evolved strategy is strictly related to scalability.
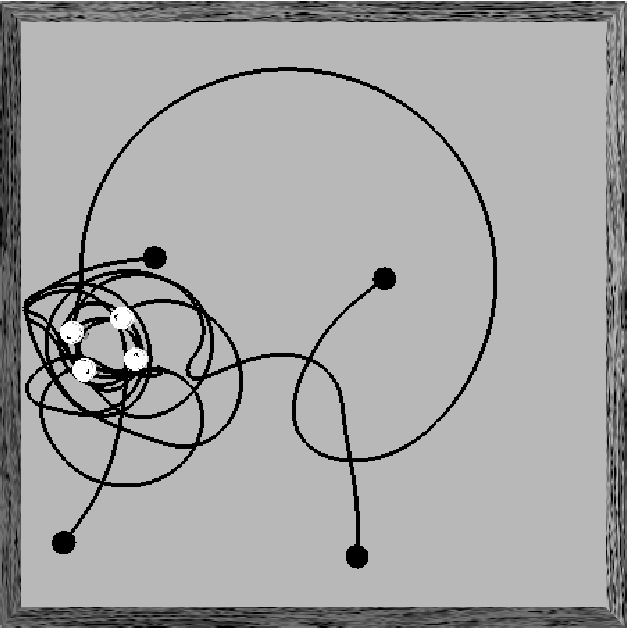
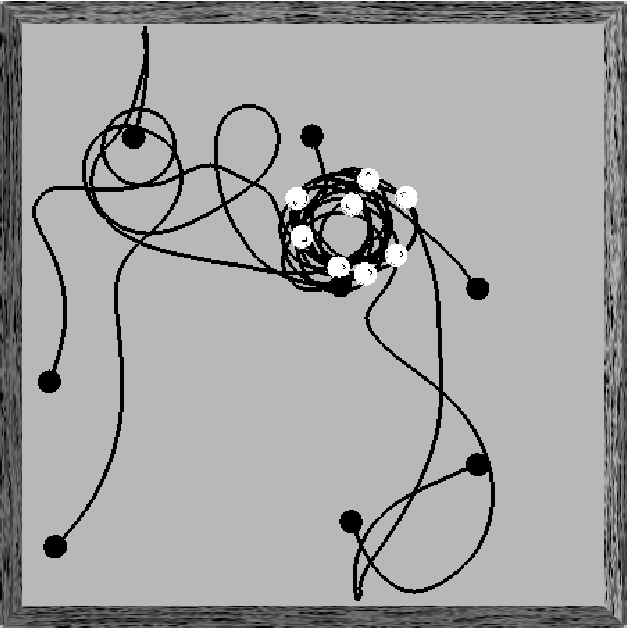
Figure 2. Left: The aggregation of 4 s-bots usually
produces groups moving in circles. Right:When the group is
bigger, the movement is more disordered and the s-bots
continuously change their relative position.
The scalability of the best controllers of each evolutionary run was
evaluated for s-bots groups ranging from 4 to 40. For
this purpose, the aggregation quality and performance measure were
redefined.
We performed 100 evaluations for different group sizes (n =
4,8,12,...,40). The results obtained showed that not all the evolved
controllers have comparable performance. However, half of the
tested controllers present a very good scalability. The best scalable
strategy was the one produced by the tenth replication, already
analysed above. We have mentioned that this controller creates an
aggregate that moves across the arena. This is a
result of the complex motion of s-bots within the aggregate,
which in
turn is the result of the interaction between attraction to sound
sources and repulsion from obstacles. The slow motion of the
aggregate across the arena leads to scalability, as an aggregate can
continue to move joining solitary s-bots or other already
formed
aggregates, eventually forming a single cluster of s-bots.
Figure 3 plots the performance of this controller as a function of the
group size. We can see that the performance gracefully degrades when
the group size increases over the
limit used during evolution. It indicates that the aggregation
behaviour scales well and is not dependent on some particular settings.
The best performance is obtained with 4 s-bots, and corresponds
to the
situation in which all the s-bots have an ordered circular
motion, that
allows them to stay very close to each other. The outliers correspond
to situations in which the 4 s-bots never met each other in the
limited
time used for evaluation. When increasing the group size to 8 and
12 s-bots, we observe a drop in performance that is mainly due
to the
transition from the ordered to the disordered motion of the s-bots
within the aggregate. In this case, the aggregate is more dynamic,
continuously changing shape, size and position driven by the complex
interactions among the s-bots. We observe also a higher
variance in the
data or more outliers, corresponding to the formation of two or more
small aggregates that did not have enough time to join in a single
one. Further increasing the group size, we observe that the
performance reaches a stable level. Less outliers are observed and also
the variance in the data is reduced, because the increasing density of s-bots
in the arena makes it easier for smaller groups to aggregate in a
single one.
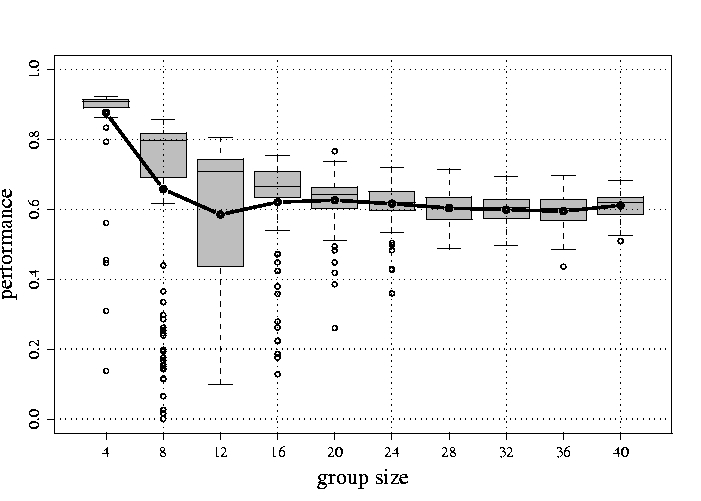
Figure 3: Scalability of the aggregation behaviour. The performance for some
group sizes is shown. The box-plot shows 100 evaluations. The average
values are shown by the thick black line. Boxes represent the
inter-quartile range of the data, while the horizontal bars inside the
boxes mark the median values. The whiskers extends to the most extreme
data points within 1.5 of the inter- quartile range from the box. The
empty circles mark the outliers.
References
- G. Baldassarre, S. Nolfi, and D. Parisi. Evolving mobile robots able to
display collective behaviour. Artificial Life, 9:255--267, 2003.
- E.Sahin, T. H. Labella V. Trianni J.-L. Deneubourg P.
Rasse D. Floreano L.~M. Gambardella F. Mondada S. Nolfi and
M.Dorigo M. SWARMBOT: Pattern Formation in a Swarm of
Self-Assembling Mobile Robots. In Proceedings of IEEE
International Conference on Systems, Man and Cybernetics,
Hammamet, Tunisia, October 2002.
- G. Baldassarre S. Nolfi and D. Parisi. Evolving Mobile Robots
Able to Display Collective Behavior. In Proceedings of the
International Workshop on Self-organisation and Evolution of Social
Behaviour, Monte Verita, Switzerland, September 2002
- V. Trianni, R. Gross, T.H. Labella, E.Sahin, and
M.Dorigo. Evolving aggregation
behaviors in a swarm of robots. In W. Banzhaf, T.
Christaller, P. Dittrich, J. T. Kim, and J.Ziegler, editors,
Proceedings of the VII European Conference on Artificial Life (ECAL),
Lecture Notes in Artificial Intelligence, volume 2801, pages 865--874,
Berlin, Heidelberg, 2003. Springer Verlag.
Control >> Aggregation >> Evolving clustering formation
|